Select Page
12 Days of ECHO, Tenth Day: My Admin Gave to Me, Epicor Performance and Diagnostic Tool Checks!

12 Days of ECHO, Tenth Day: My Admin Gave to Me, Epicor Performance and Diagnostic Tool Checks!

SQL and the Reporting Engine


Epicor ERP 10 provides the Performance and Diagnostics Tool as part of your Epicor Administration Console.  While the tool is often installed when setting up an E10 solution, its often forgotten about afterwards.  The full tool has lots of capabilities, but I’d like to highlight the Config Check”. 


When first run, you have to go to Options-Settings and define which E10 application you are going to check, along with the Epicor username/password to access the data. 


Then, click the “Check Configuration” button and wait a few moments. The tool will go look at several parameters and find out which settings are Pass, Warning or Fail.  Depending on your environment, you’ll want to qualify those warnings or failures, as they might not be as disastrous as it seems.   


Here’s the output of one of our hosted Epicor servers running 10.2.500.  Looks like there might be something wrong with the SQL Setup. 

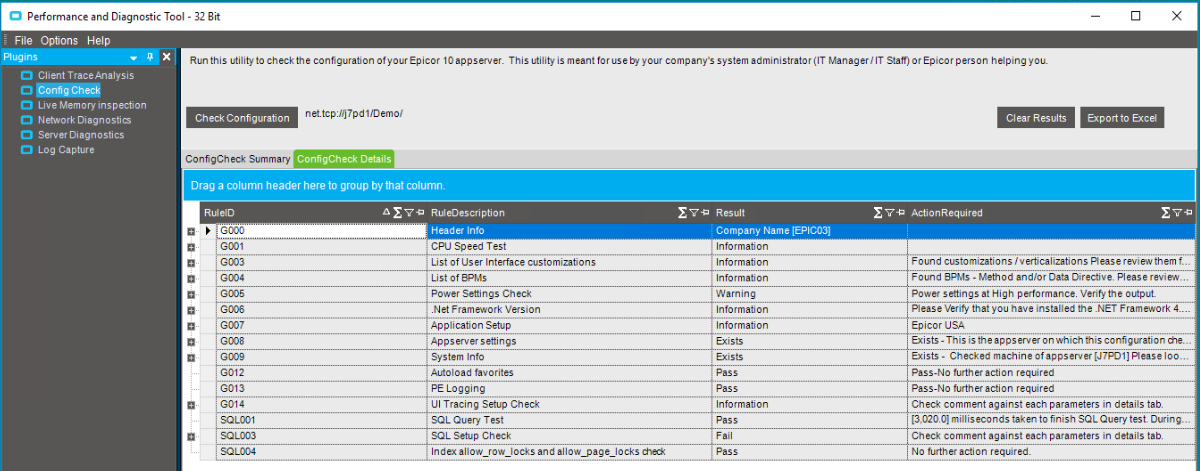
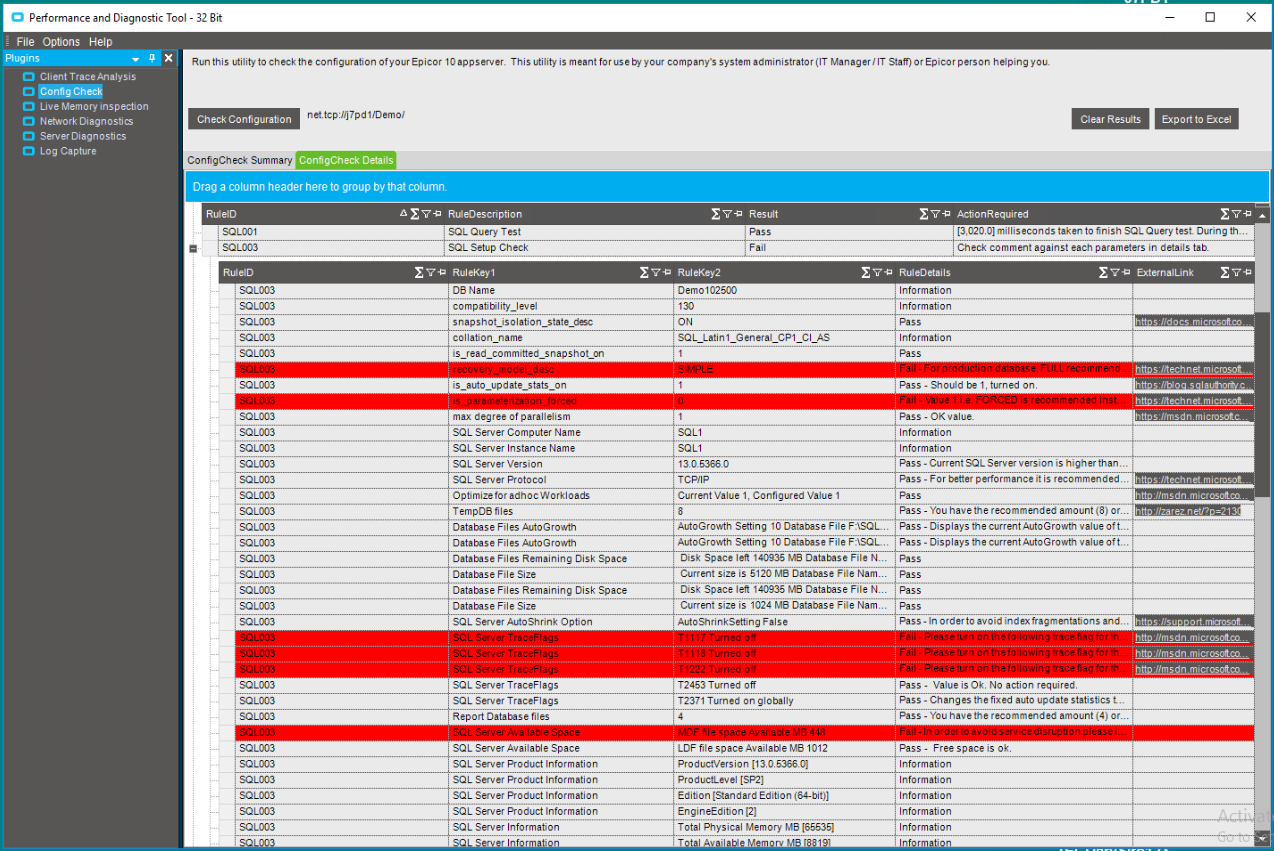
Using the ConfigCheck Details shows the underlying issues, in this case, there are several issues!  Some of the red lines are problems (like I might not have enough space in the SQL MDF file), while others are not (SIMPLE recovery mode is not a problem for this application)

In any case, before I start tuning, tweaking and fixing, I always export the result to Excel so I have a record of what it looked like today.  After I fix these items, I’ll re-run and re-export the check to show my client that the appropriate items were fixed.  Of course, if items are flagged but not fixed, I’ll include an explanation of why.  For example, Simple recovery mode on a SQL databases means I don’t have to worry about transaction log growth.  (See our prior post “SQL Transaction Log Maintenance”)


If you need details on how to correct each issue, you can drill into the ExternalLink provided. Warning – many corrections will require downtime, so while you can run the tool anytime, correcting things will likely be during a maintenance window.


I recommend running this tool as part of a quarterly or annual basis just to help keep your Epicor E10 system running smoothly.

If you liked reading the “Tenth Day of ECHO” return to our main list to read all of the other “12 Days of ECHO” posts.


Do you have questions or need assistance with your Epicor system?  Please feel free to Contact Us and see if we can help get your bits and bytes in order.

12 Days of ECHO, Ninth Day: My Admin Gave to Me, Fixes so SSRS Won’t Hog Epicor CPU!

12 Days of ECHO, Ninth Day: My Admin Gave to Me, Fixes so SSRS Won’t Hog Epicor CPU!

SQL and the Reporting Engine


Epicor ERP 10 requires two primary SQL functions, the SQL Engine and the Reporting Engine, also known as SSRS – SQL Server Reporting Services.   Each require a SQL licensed, but if you run both on the SAME operating system instance, you can pay for only one set of licenses. If you run the SQL Engine on one OS and SSRS on another, you must purchase TWO sets of licenses – an expensive choice.  Therefore, most clients choose to run SQL and SSRS on the same OS. 


This co-existence can be a problem when one or the other get resource hungry and crowds the other out.  For example, SQL (the engine) will use ALL available RAM, and starve any other application (sometimes even the Windows OS itself!).  Once of the tuning options we set is to limit SQL RAM to approximately 80% of the total server RAM.  If SSRS is running on the same OS, then we also need to leave some room for it to do it’s job. 


Another resource grab is for the CPU, if a poorly written SSRS report is let loose, it can take too much time and CPU and starve the SQL Engine for CPU cycles, effectively driving CPU utilization to 100% and before you know it, SQL is s-l-o-w, and Epicor responds in kind.  Users call up saying Epicor screens are frozen, reports are queueing up and not running, in general, the business comes to a full stop. 


Looking at Task Manager / Details and seeing SSRS service “ReportingServicesService.exe” at 100% is a dead giveaway. The quick fix is to restart that service.  Resources are released and SQL engine gets the horsepower it needs to keep running.  Unfortunately, the currently running reports fail. 


Microsoft used to include a function called “Resource Manager”, but they phased that out a few versions ago.  


The best solution is multi-pronged attacktake your pick 

  • Split SSRS off into its own server (don’t forget to buy the license!) 
  • Monitor CPU utilization on your SQL servers and alert someone if they get pegged at 100% 
  • Create a Performance Monitor Alert and Task to restart SSRS if it goes to 100% 
  • Ensure any problem SSRS reports are debugged on a test server where they won’t impact production performance. 
  • Use a 3rd party tool called “Process Lasso Server Edition” from www.bitsum.com to force SSRS to behave. 


In our EstesGroup Cloud Hosting ECHO hosting model, we use a combination of these solutions to ensure your Epicor ERP 10 system stays responsive. 

If you liked reading the “Ninth Day of ECHO” return to our main list to read all of the other “12 Days of ECHO” posts.


Do you have questions or need assistance with your Epicor system?  Please feel free to Contact Us and see if we can help get your bits and bytes in order.

12 Days of ECHO, Eighth Day: My Admin Gave to Me, Tips on Epicor SQL Transaction Log Maintenance!

12 Days of ECHO, Eighth Day: My Admin Gave to Me, Tips on Epicor SQL Transaction Log Maintenance!

Epicor and Microsoft SQL Transaction Log Maintenance – Performance Tips and Tricks


Many Epicor 10 ERP installations suffer from a “lack of DBA”. It’s not for lack of desire, but keeping a full-time DBA (Database Administrator) on staff can be expensive.  However, a lack of DBA can ultimately wreak havoc in your Epicor environment. 


SQL Databases all have transaction logs. The goal of such a log is to keep the data integrity in case of data loss, corruption or other bad things.  Think of a transaction where you transfer money from checking to savings. Imagine if the balance in your checking went down, but the savings didn’t increase by the same amount!  That would be a huge problem, and SQL transaction logs ensure that doesn’t happen. The entire transaction takes place, or none of it.  Another benefit to a transaction log is that it can be used to restore a database to a specific point in time. Imagine if you could rewind the clock and restore your database to the minute BEFORE the user posted all of today’s activity to the wrong GL account, or similar mayhem.  Point-in-time recovery can be very helpful, without it you are restoring from last nights full backup, potentially losing a day of data entry. 


Backups Stop Running?


If backups stop running (for ANY reason), then SQL transaction logs start filling up. Once a transaction log fills up (or fills the disk it’s stored on), then the database stops, and all your Epicor users stop too.  Therefore, monitoring your disk space (see yesterday’s Epicor ERP 10 Server Disk Space report) is critical, but so is knowing about SQL Transaction logs, and what they mean to your business and data recovery. 


SQL Databases can be set to SIMPLE recovery mode, where the transaction log doesn’t grow, and can’t be used for point-in-time recovery.  This is great for databases where you don’t need recovery – Temp databases, SSRS Temp databases, Epicor Test and Training databases, and others. 


SQL Databases can also be set to FULL recovery mode, where the transaction log will grow (and grow) until you do a transaction log backup.  Once the backup is complete, SQL knows it can reuse that space, and the transaction log wraps and generally doesn’t grow beyond that.  It reaches statis, and that’s good. 


Help!


About once a month, we get a call from a frantic (future) client who’s Epicor is crashed, and their disk is full, and the SQL transaction logs are HUGE – often larger than the database itself.  Our EstesGroup DBA’s jump to the rescue!  We generally perform emergency surgery – set the database to simple recovery mode, truncate the logs, set the database to full recovery mode and then do a full backup.  Now, before the DBA’s out there jump up and start yelling, I know that those steps can be potentially risky.  BUT, if the application is down, and time is money, then getting things back up and running FAST is the name of the game.   


After the system is back and running, then we look at why the transaction logs got that big and what can be done about it.  It usually involves backing up the transaction log regularly or setting the databases to SIMPLE recovery mode (with the understanding that point in time recovery is no longer an option for those databases). 


And, do yourself a favor, don’t backup your transaction logs to the same volume that the logs themselves are stored on!  It’s like shooting yourself in the foot – it hurts, and you don’t want to do that right before the holiday! 

If you liked reading the “Eighth Day of ECHO” return to our main list to read all of the other “12 Days of ECHO” posts.


Do you have questions or need assistance with your Epicor system?  Please feel free to contact us and see if we can help get your bits and bytes in order.

12 Days of ECHO, Seventh Day: My Admin Gave to Me, Tips on Epicor ERP 10 Server Disk Space!

12 Days of ECHO, Seventh Day: My Admin Gave to Me, Tips on Epicor ERP 10 Server Disk Space!

Epicor ERP 10 Server Disk Space – Where’d It Go?


Do you ever wonder where your server’s disk space goes?  Many times, you might not even notice until a server crashes with an ‘out of disk’ error message, or some application stops working.  Only then might you start digging around and find that a volume is out of disk space.  Proactive monitoring is essential, and if you sample free disk space once a day for a month, Excel will tell you when you’ll run out of disk space.  However, if you proactively monitor and cultivate your disk usage, your server will reach a general stasis and disk usage will remain relatively constant.


A disclaimer – if you never purge old data and keep every document, sales order and schematic from the beginning of time, you’ll keep buying more disk space.  However, disk storage is cheap, management of it is expensive!


If your Epicor Terminal Server runs lower than about 6GB free, Epicor.exe will start throwing errors.  You don’t even have to be THAT critically low before that will start impacting functionality and performance.  Disks that run low on space suffer fragmentation, and even on an SSD drive, the work of allocating new disk space on a mostly full volume hurts!


So what are the common culprits in an Epicor ecosystem?

  • IIS Logs (see our prior holiday report on IIS Log Sprawl)
  • SQL Transaction Logs (report coming soon)
  • Enabling Epicor server tracing in the Admin Console can be helpful, but the C:\inetpub\wwwroot\app\server will grow with those logs quickly!
  • The share called \\appserver\EpicorData stores many files; bad BAQ’s, BPM’s, and reports can leave large files here.
  • Server administrators often to download patches and new versions, extract them and forget to remove the downloads and extractions when done with the upgrade.


Here’s an example over a month of a SQL server transaction log volume.  Guess what day was a bad day?  And to boot, it was at midnight, when everyone was home, not watching the servers.

How can you manage this?  Use a tool like TreeSizeFree (from JAM Software) will quickly reveal the disk hogs, and the built-in windows tool forfiles.exe will make short work of removing the old files.


You can also use a management tool like EstesGroup Managed Services does and gain visibility into the critical component long before it becomes a problem in your business.


If you liked reading the “Seventh Day of ECHO” return to our main list to read all of the other “12 Days of ECHO” posts.


Do you have questions or need assistance with your Epicor system?  Please feel free to Contact Us and see if we can help get your bits and bytes in order.

12 Days of ECHO, Fifth Day: My Admin Gave to Me Too Much RAM for My Epicor VM!

12 Days of ECHO, Fifth Day: My Admin Gave to Me Too Much RAM for My Epicor VM!

Too Much CPU & RAM for Epicor Application Server


Sometimes, more memory is not better.  Often, server admins will throw more resources (CPU and RAM) at a server to make it go faster.  Check our tidbit on SQL Licensing to see what that might hurt your licensing model, and in general, with SQL, the more RAM the merrier.  There is a decreasing return on investment however, and when it comes to your Epicor application server, we often see clients who over-commit resources and cause hypervisor performance issues.  Assuming you run in a virtualized world (as most of our clients do), over-committing CPU and RAM can cause the host machine to ‘thrash’ and actually run slower than if you had less resources.  For more details, search on NUMA boundaries and “memory ballooning”.  Check your Epicor application servers, if they have a lot of unused RAM and low CPU utilization, you might be a victim of over-committing resources. 


If you liked reading the “Fifth Day of ECHO” return to our main list to read all of the other “12 Days of ECHO” posts.


Do you have questions or need assistance with your Epicor system?  Please feel free to Contact Us and see if we can help get your bits and bytes in order.

[pardot-form id=”856″ title=”Blog Forms Submission”]

12 Days of ECHO, Fourth Day: My Admin Gave to Me Tips on SQL 64k Clusters!

12 Days of ECHO, Fourth Day: My Admin Gave to Me Tips on SQL 64k Clusters!

Tips on SQL 64K Clusters and Epicor SQL Services Database Bytes


Microsoft SQL likes to do all its input/output in 64k chunks, but Windows likes to format hard drives in 4K chunks called “clusters”. Studies have shown that formatting the volumes that store SQL databases and transaction logs benefit from 64k clusters – up to 35% better performance!  To check what your cluster size is, open an Elevated Command Prompt and type “CHKDSK D:” (where D: is where your databases are stored).  The line with xxx bytes in each allocation unit” should say 65536, and not 4096.   


If you find your server admin formatted with the default 4096 allocation unit, then changing is easy – just kick everyone out of Epicor, shutdown the SQL services and backup the entire volume.  Then, reformat with 64k clusters and do a volume restore.  Restart SQL services (and your Epicor Task Agent) and let the users back in! 


Sound like too much for you to handle? 

Give us a call or send us a message, and our Database Admins’s would be happy to assist. 


If you like this tip and trick post, please read our other 12 Days of ECHO.

About the Author

Daryl Sirota has served for 35+ years in IT, both as a sole proprietor and as a senior team at System Source, and now as VP of Managed Services at EstesGroup. He loves to travel and currently resides near EstesGroup headquarters in Loveland, Colorado.

Daryl Sirota – VP, Technical Services